


In this trading guide, you will learn how to trade the descending triangle like a seasoned pro. In the technical world of trading, there are different patterns to be aware of that will allow you to make more informed trading decisions. Once you master the descending triangle chart pattern, a simple chart pattern, you will gain a clear understanding of what happens after the price action.
This simple chartpattern can be spotted on long term charts and short term charts. It doesn’t matter what your trading style is; whether you are a swing trader or day trader. Anyone can use descending triangle technical analysis to spot profitable trading opportunities.
In this article, we will explain the requirements of the descending triangle and how to spot it in real time. We will also cover the psychology behind the descending triangle reversal .

Descending triangle pattern
The descending triangle is a chart pattern that continues to develop in the middle of a downtrend. However, in some cases, this can act as a descending triangle reversal. Also known as an ascending descending triangle pattern.
The descending triangle stock pattern is a versatile chart pattern that is viewed as both a continuation and a reversal pattern at the same time.
The reversed version of the descending triangle is the ascending triangle pattern that we talked about a lot.
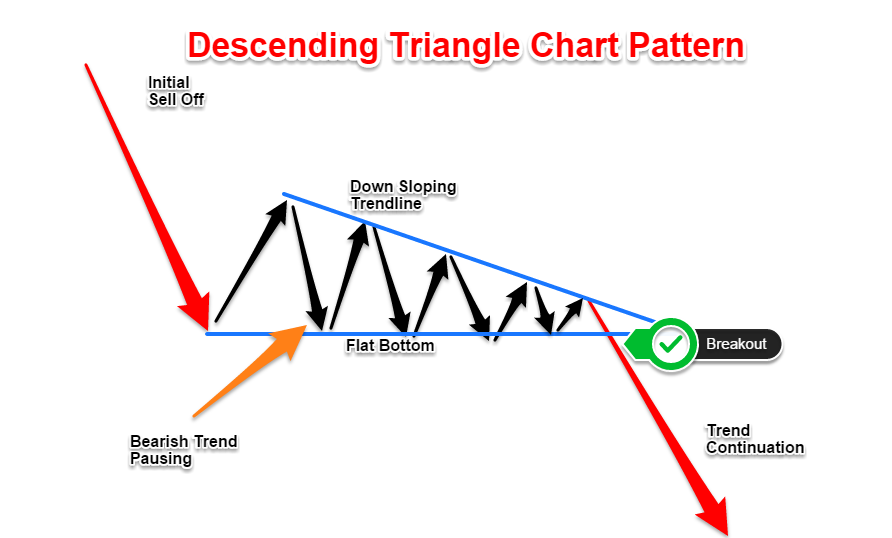
The main features of the descending triangle pattern are:
- A flat support line.
- A descending trendline connects a series of lower highs.
- Flat support and descending trendline converge to a point.
Imagine that, at the top of the descending triangle chart pattern, there is a downtrend consisting of a series of lower highs connected by a downward sloping trendline. At the bottom, there is a solid support layer that is tested at least 3-4 times. A support level is a bottom that price cannot push lower.
Below you can see the ideal descending triangle chart setup:
As we stated before, this chart pattern works on the one-minute chart, the five-minute chart, all the way up to the higher timeframes. Whether you are scalping or swing trading, you can use it with multiple assets. This includes individual stocks, global indices, commodities, Forex , or cryptocurrencies.
The psychology behind this pattern can be explained with the fundamentals of supply and demand imbalance. You can see the descending technical analysis triangle as a pause in the downtrend. It is understandable that demand is exhausted during the descending triangle development.
This downward compression to the downside is what makes the pattern bullish.
Remember: all continuation patterns, such as bullish flags , rectangle patterns and others that you can find on our Trading Strategy Guide website, must have the context of a trend.
See the chart below:
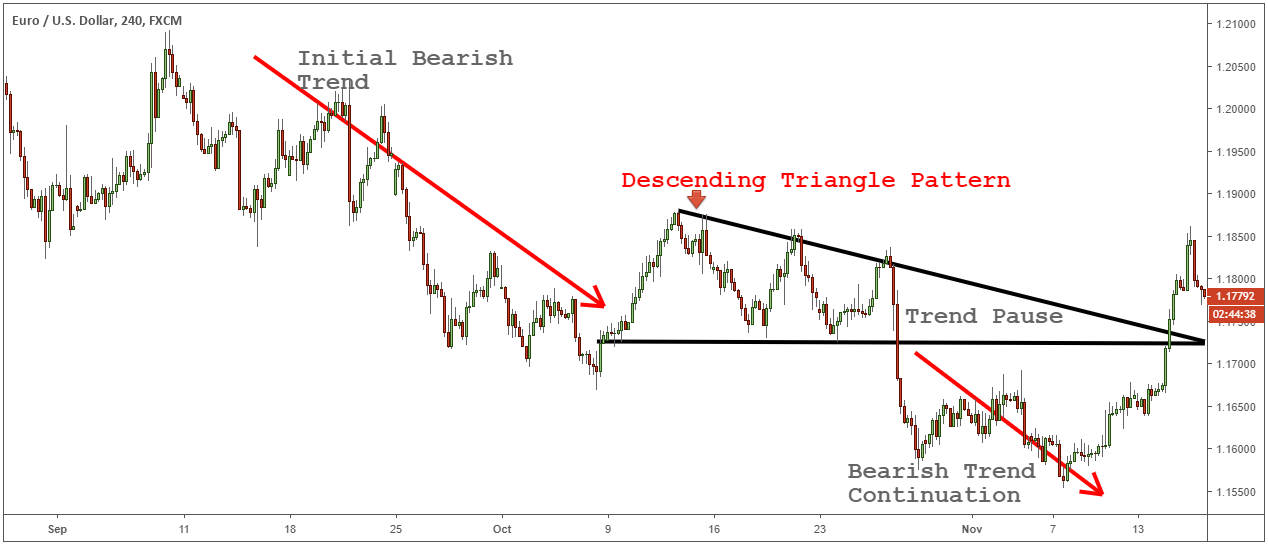
In the next part of this trading guide, you will learn how to trade the descending triangle. Let’s see if we can get some trading ideas from the descending triangle breakout.
Descending triangle
First, let’s study the descending triangle inversion case. Typically, descending triangles are stronger when traded against the backdrop of a trend. It is also stronger when traded in the prevailing direction.
However, the descending triangle reversal pattern has the potential to reward you with larger profits if traded in the right context. We only trade the descending triangle reversal pattern when this price formation develops towards the end of an uptrend and in the context of an uptrend.
A reversal chart pattern occurs when buying activity declines and the market fails to make new highs. This shows that the supply-demand imbalance is shifting in favor of sellers as buyers dry up.
In this case, we will be looking for a flat bottom to be conquered by the bears. A breakout of support potential could signal a strong trend reversal.
Let’s look at an example of an intraday trading opportunity to capture a reversal using a descending triangle on the intraday timeframe.
See the GBP/USD Forex chart below:
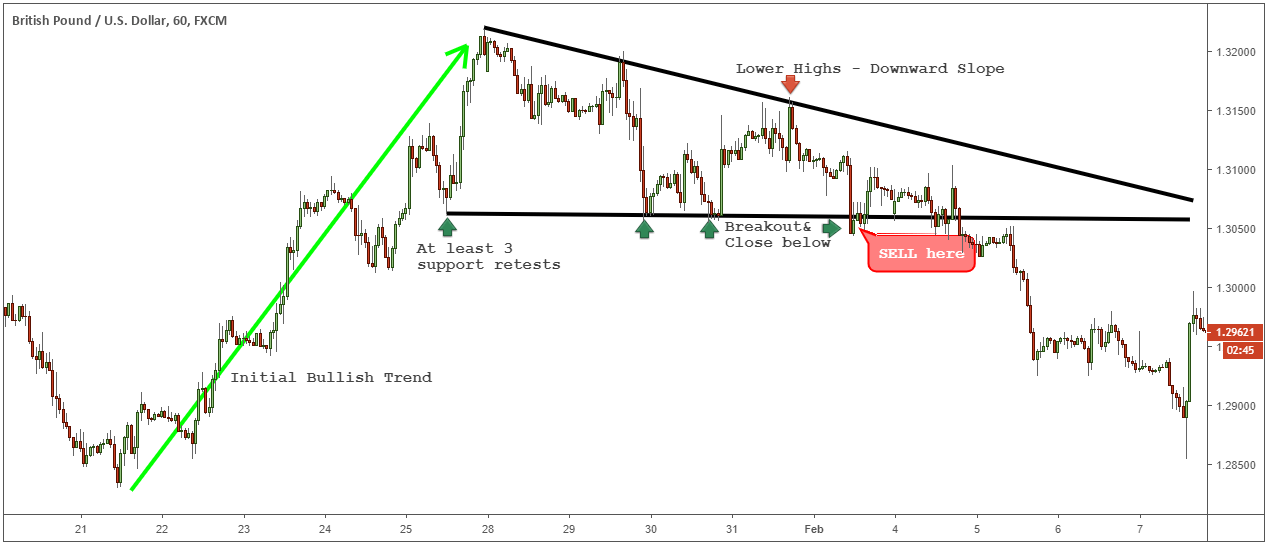
When trading the descending triangle, we are always looking for a support breakout to provide us with a potential entry point. Unlike textbooks that say to teach retail traders that support or resistance levels will be stronger the more retests we have; contrary to the opposite is true.
Note: The more support is tested, the weaker it becomes.
In addition, the breakout candle must also produce a close below the flat support for a valid trade setup.
But that’s not all.
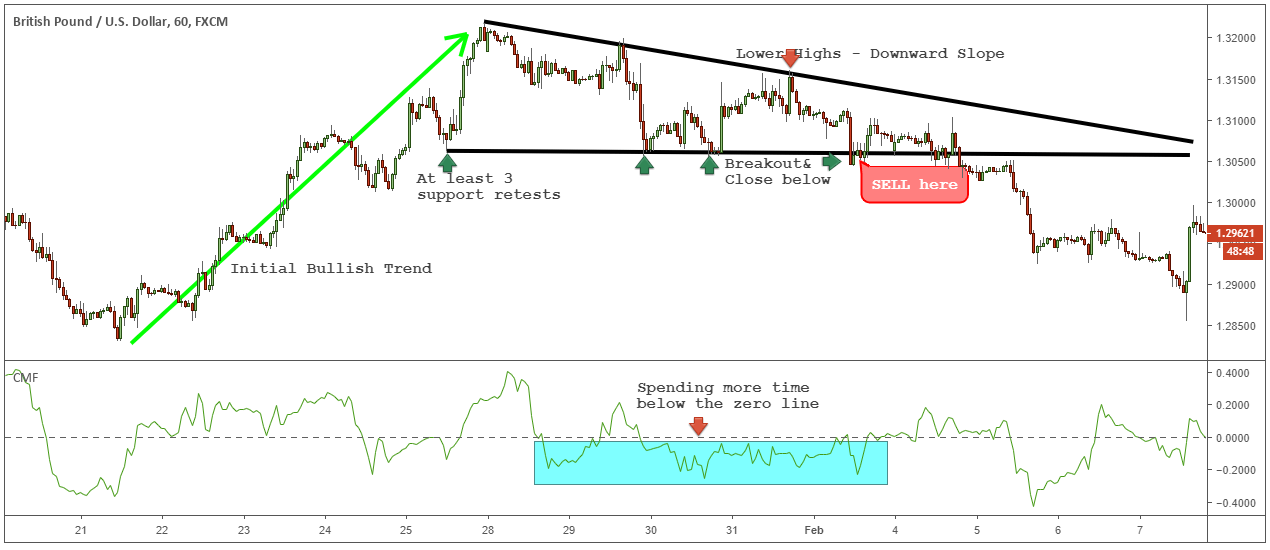
We must take a step forward and confirm the breakout using the Chaikin Money Flow indicator to confirm the supply-demand imbalance. The readings we get from Chaikin Cash Flow will tell us if sellers are going to step in or not.
You only have to check if the Chaikin money flow takes longer below zero during the time when the descending triangle appears. Indicators below line 0 indicate selling pressure.
See the intraday chart below:
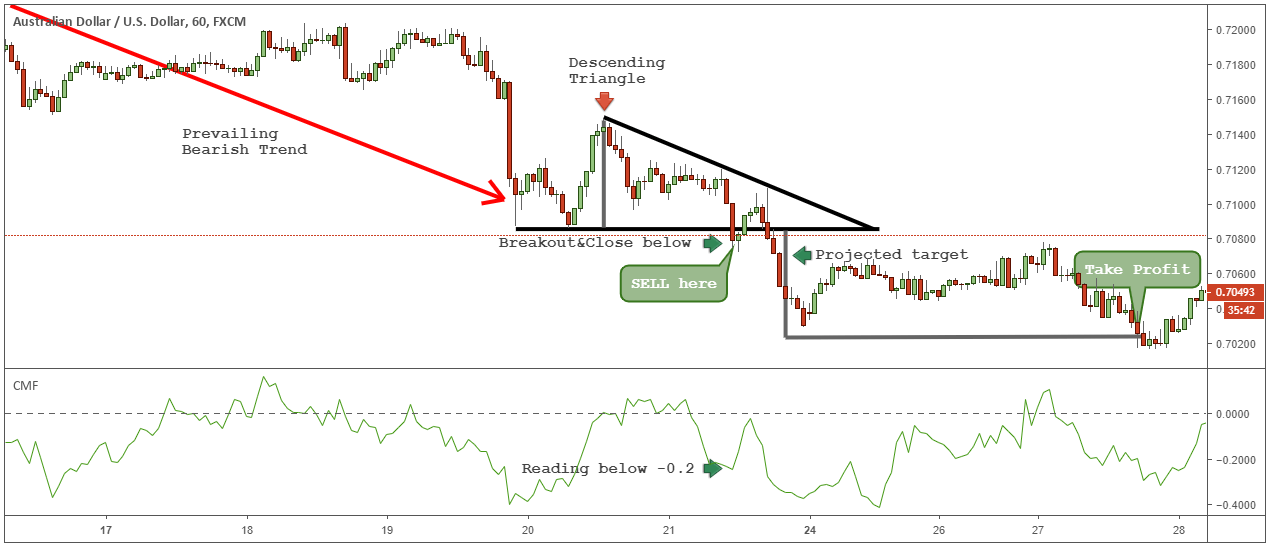
For our exit strategy, we will be using one of our favorite trading techniques. Instead of focusing on static and random profit targets, we will use the dynamics of price action to get a more accurate profit target.
To get our profit target simply measure the depth of the triangle. Just count how many pips there are from the flat support line to the highest point of the triangle. Once you have that measurement, project it to the downside starting from flat support.
See the chart below:
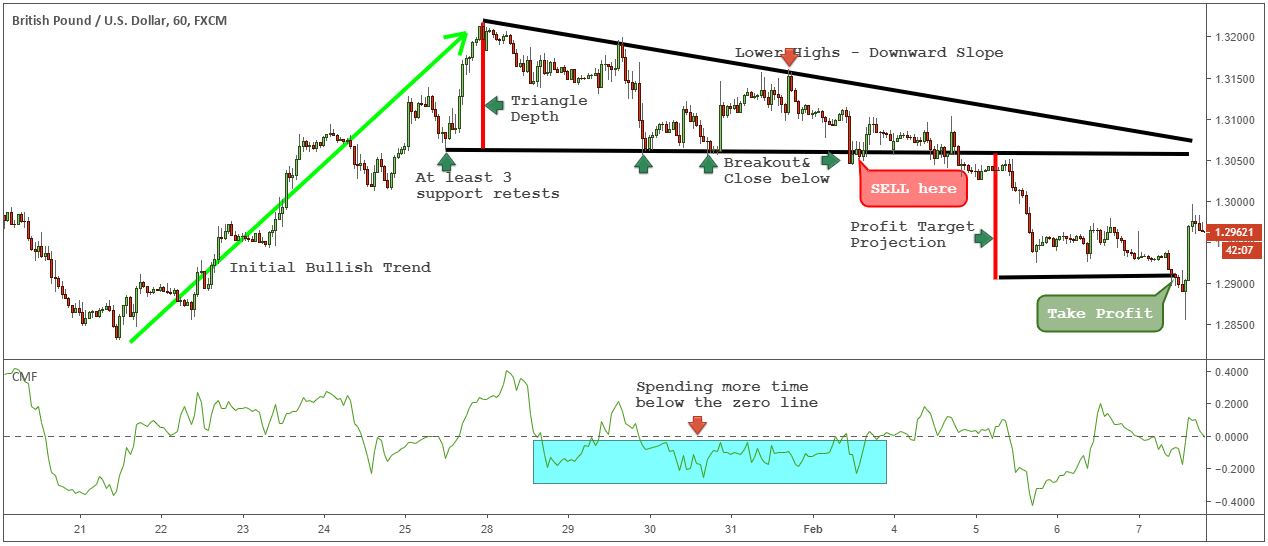
You can see how measuring the expected depth of the triangle becomes a very accurate profit target. This is a powerful exit strategy that can maximize your profits.
Now let’s stop for a moment and see how to properly trade the descending triangle as a continuation pattern.
Descending triangle trading strategy
It is important to remember that the descending triangle chart pattern is traditionally used to predict potential breakouts in the direction of a downtrend. In the following example, we will combine the descending triangle with the strength of technical indicators.
Using the Chaikin Money Flow indicator, along with the descending triangle breakout creates a very powerful trading strategy. One of the main, unique features of the Chaikin Money Flow indicator, is its ability to gauge buying and selling power.
Most retail traders struggle to gauge the equal of supply and demand in the market. You can resolve this struggle by switching to Chaikin Cash Flow.
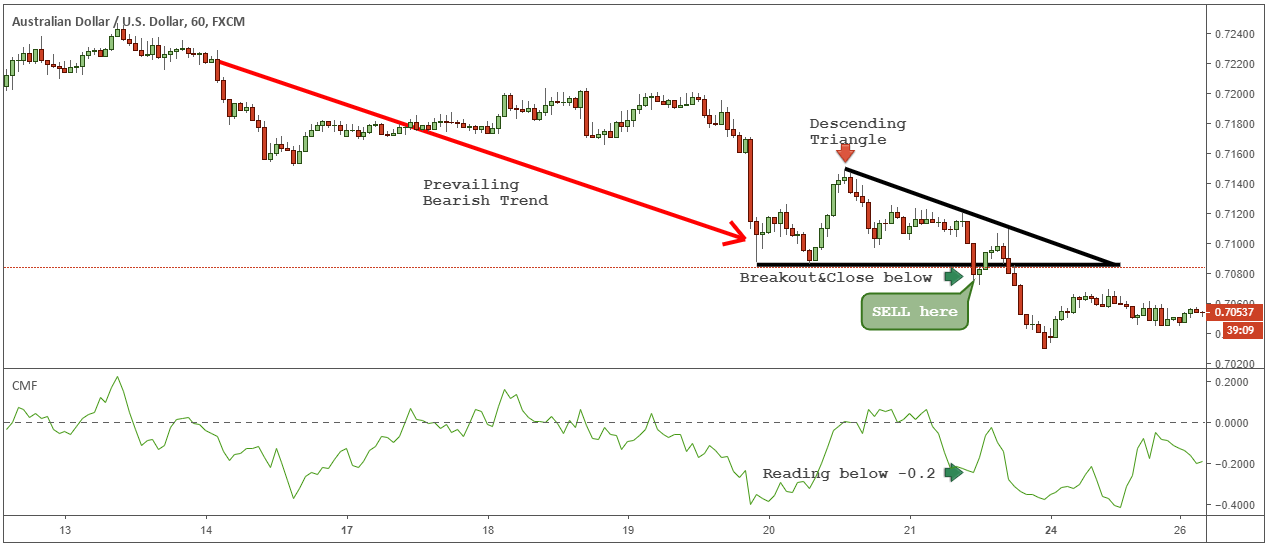
In this strategy, traders only need to see an agreement between the support breakout and the Chaikin Money Flow reading. When the descending triangle breakout occurs, we need to have Chaikin Money Flow reading below -0.2.
The profit target forecast is based on the same exit strategy we used before. Measure the triangle depth and project the same price distance starting from the flat bottom.
Conclusion – Descending triangle chart pattern
Trading involves risk and hard work. Make sure you first familiarize yourself with the descending triangle pattern before you commit any real money to this chart pattern. Stop searching for the Holy Grail and learn to trade like a pro. Using simple trading tricks is powerful when used in the right context. Be sure to read our latest article on Technical Analysis Strategies .
The descending triangle chart pattern can be combined with your preferred trading strategy. Once you learn to identify them and train your eyes to see them in real time, it will help you better understand the price action. The supply and demand imbalance inside the descending triangle reversal will almost always produce fast and violent breakouts.
Also, be sure to learn about the Symmetrical Triangle Trading Strategy.