Forex trading
Forex trading (also ‘Forex’ or ‘FX’) is the buying and selling of another currency. Trades are placed based on exchange rates listed on over-the-counter (OTC) or exchange exchanges.
This market is the largest in the world, seeing over $5 trillion in transactions every day. Forex can be traded five days a week, around the clock. There is no central exchange for the currencies, so they are traded globally at a variety of sources.
In each currency pair, the first is listed as the ‘base’ currency and the second. So, for EUR/USD, the quoted price would be how many US dollars are required to buy 1 Euro.
Almost all financial news, or global events, will affect forex prices. With markets available 24 hours a day and many brokers offering low commissions, tight spreads and high leverage, forex trading has become extremely popular with retail investors. Still, the risk is high, especially where leverage is involved.
Top 5 forex brokers
How Forex pairs work
Forex pairs are the starting point for forex trading. A “pair” is two currencies that will be traded. So a trader would buy one currency, using the other. So, for example, with the GBP/USD pair. Traders will buy British pounds, using US dollars.
When prices are quoted, they are always the second currency, buy the first. So with EUR/GBP for example, the price quoted is the cost, in pounds, to buy 1 Euro. Note, however, that the decimals will move, making the price look a bit strange to anyone using to exchange money for their vacation. In the EUR/GBP example, the exchange rate is currently 8454.8. For European-oriented holiday makers, that equates to 84.5 pence buying 1 Euro.
The currency of the trading account does not matter, the broker will convert them as required to allow traders to buy or sell currencies. Retail forex trading is simply speculating on the movement of exchange rates between forex pairs.
Which are the major forex pairs?
- EUR / USD
- USD / JPY
- GBP / USD
- USD / CHF
Established pairs, which are traded in large volumes and are based on the US dollar, are known as ‘major’ pairs. Beyond these more traditional forex pairs, there’s quickly becoming a wider range of currencies to trade – these are known as ‘minor’ or ‘exotic’ pairs. Binary options brokers currently offer options on about 40 to 50 different currency pairs from around the world. Emerging markets have added a whole new element to Forex trading. These markets include regions such as South America and Asia. Currencies typically represent market confidence in the entire economy of the region concerned. With such a wide range of factors contributing to such economies, it’s easy to see why prices fluctuate constantly.
However, small and exotic pairs see lower volume levels, which can affect volatility, but is also available at times.
What is an exotic forex pair?
- TRY – lTurkish ira
- NOK – Norwegian Krone
- SEK – Swedish Krone
- HKD – Hong Kong doll
What affects the Forex market?
So what affects the FX market? Pretty much everything. Almost every piece of global news can have an conceivable impact on currency prices. For example, the collapse in oil prices led to a similar drop in the value of the Russian ruble. An economy closely linked to oil will rise or fall with the value of that commodity. There are additional factors to consider of course, but the example is clear.
A more subtle example is the Indian rupee. The new governor at the Reserve Bank of India has boosted investors’ confidence in the recovery plans laid out for the Indian currency. That confidence was reflected in the rupee’s strong performance. While India’s currency directly benefited, other Asian currencies also jumped, with regional performance being a factor helping both the Philippine peso and the Thai baht.
Another example is foreign policy. If a country like China partnered with Russia on gas, both currencies could benefit. If markets believe that one trading partner has the better side of the deal, one currency can gain while another suffers. Traders can have views on future foreign policy and investments accordingly. These examples are some of the more obvious and larger market drivers, but illustrate the fact that forex is a very complex market.
Mobility in the Forex market
Uncertainty in the market often leads to volatility. The global economy is definitely uncertain right now, which means there are plenty of opportunities for Forex traders. Binary options provide an opportunity to profit from uncertainty. The range of forex currencies available to trade through binary options brokers has never been greater and the right strategy, for the right currency, can prove very beneficial. Our review highlights brokers who focus on binary options exchange rates.
Forex opening hours
Some beginners skip some forex basics and go straight to strategy. That can be a mistake, and leads to a lot of lessons learned the hard way (losing trades). One such “basic”, is knowing the hours when certain markets will open.
The forex market is open 24 hours a day. This is because banks and corporations are open at different times around the world. This demand provides liquidity to forex pairs. However, each hour of the day tends to be different based on which part of the globe is open to business. Understand forex market hours and hourly trends, and you will be better able to apply your strategy at the right times.
Forex Market Session
The major markets are open at different times throughout the day. Which markets are open directly affects liquidity and volatility and forex pairs.
For example, EURUSD has the highest liquidity and volatility during the London and New York sessions, especially during the overlap period when both London and New York trade.
USDJPY usually has the most volatility when Tokyo first opens and when New York opens hours later.
Currencies typically see increased liquidity when one or more markets are actively traded or used, that currency is open to business.
Here are the GMT-based forex sessions for UK Traders:
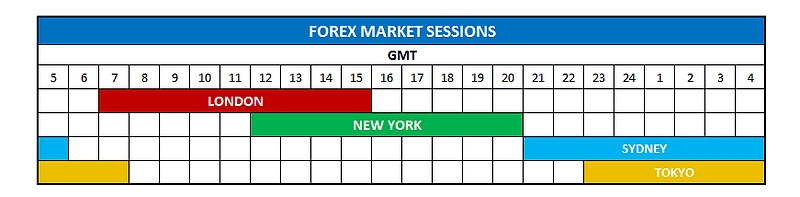
The chart does not show every market in the world. But the ones shown are the big market for forex. The Canadian market is open while New York is open and London overlaps with other European markets.
Germany opens an hour before London; Therefore, some argue that the is open, and not the beginning of the London session. Volatility, on average, did not see a marked increase until London opened.
Intraday volatility
The major sessions directly affect the volatility of the currency pair. Hourly volatility does not follow a certain trend. If your strategy is based on volatility or you are using a trend following strategy, focus on the times of the day when price moves are greatest.
If you are using more than one range trading strategy, or prefer low volatility, trade during the sedation. Check where the charts show reduced hourly volatility.
08:00 to 17:00 GMT offers the best trending opportunities, with 13:00 to 17:00 typically providing the biggest moves.
Those looking for declining volatility, or more likely a silent range, keeptrading between 20:00 and 05:00 GMT.
USDCHF is very similar to EURUSD in its hourly volatility structure, although USDCHF moves less overall per day and therefore overall hourly volatility is less than a few pips.
NZDUSD has a very similar hourly volatility to AUDUSD and both move roughly the same every day.
Time End
Learning the basics, like what market sessions and hours mean to you as a trader, can be of great help in strategy and timing. No matter what timeframe you trade, create a checklist that helps you identify the type of market you are looking to trade. Don’t try and ‘force’ the transaction. This will also help filter trades and withdrawals in good opportunities.
Forex and Binary Options
The main advantage of Binary Option over Trading Forex is the defined and limited loss you can incur on any given trade. When you buy a Binary Option that you know at the start, what will be your maximum loss. It is determined by the cost of the option itself. You can also determine your Forex losing trades by adding a Stop Loss order to your position, but the latter two things can come into play;
- An unstable price break for you where you were planning to stop a loss after, say, 30 pips, but you ended up being stopped after more than 30, due to market volatility .
- The temptation to move Stop your losses as the market approaches because you feel the momentum won’t last. In the end, this can cost you more than you initially thought about risk in trading.
In other words, it can take away the need for disciplined risk management. Often traders end up emotional trading which can end up being disastrous. With Binary Options, your maximum loss is always fixed and there is no risk of further loss.
This is also connected to the concept of volatility, with Binary Options it really doesn’t matter how the market moves as long as the money is out at expiration, while having a Forex position can often cause you to lose money due to high market volatility – to then see the price move back in your favor.
While both trading methods share many common features, there are additional elements that set them apart:
- Leverage . Binary options are usually offered without leverage. Traditional Forex often offers a large amount of ‘equipment’. Leverage is a double-edged sword. Some traders will claim the extra profit potential it offers, others will be concerned about possible losses resulting in leveraged trades.
- Risk . The risks and rewards are obvious from the start with binary options. The best and worst cases are both known. In more traditional forex, profit or loss may not be apparent until the trade is closed. Leverage exaggerates this problem.
- Capital requirements . Traditional forex will require more cash on the account than binary options.
- Flexible . Binary Options can provide Touch and Range options in a simple way. Similar trading profiles can be achieved with regular forex trades, but it requires more thought on behalf of the trader.
- Expired date . Forex traders can move in and out of trades with no clear endpoint on any of them. Binary options require a specific expiry to be set at the start of the option.
- Monitoring . A binary option can be left to mature at expiration, with no additional risk. A forex trade needs to be monitored in case there are strong price movements that could trigger a stop loss or similar. Of course, binary can also be traded, so some traders may prefer to follow binary positions.
Transaction speed
Binary options allow very short expiry times. Expires of just a few minutes are available, in fact even as little as sixty seconds. In forex, it is very rare that the market moves enough for you to close your position in minutes let alone in sixty seconds. Given that the payouts for Binary Options are in the range of 75% to 90%, you can buy an option for say, £200 and get your payout between £150 and £180 in just a few minutes.
Distance to target
With Forex trading, you enter a position with a price target where reaching a certain target is bound to be far from the current price level. Binary Options allow the target price, the strike, to be an amount, creating a higher chance for the Option to have money at expiration. With the forex target price likely to be far from the current market price, a larger price move is required to be profitable to the same extent.
In Forex if current market price for EUR/USD is 1.1200 you enter the trade with the idea of a rising or falling market let’s say 20 pips, while in Binary Options the strike price will be the current market price of 1.1200 and your option must be above or below that price even by 1 pip for you to withdraw.
Advantages of Forex
The biggest drawback when trading Binary Options is your required win rate. In Forex trading if you are applying the risk/reward ratio correctly your personal profit should usually be higher than your loss. This is because you should enter each trade with Target profit higher than Stop Loss, for example 35 pips vs 25. This means even if you are only right 50% of the time you should make money, like Your winning trades will earn more than your losing trades.
This concept doesn’t work for binary options and it’s easy to see why. With bonuses around 75-90%, traders must win many more than 50% of their trades to be profitable. With each individual trade, more money will be risked, more will be won in case the option ends in money. In this scenario, you have to get it right more than 50% of the time to return the overall profit.
Also, with binary trading there is no real secondary market. Once you have bought an option, you may want to exit the position before expiration – you may be trying to minimize your losses or maximize your profits if you think the market is changing. As a result, you may find yourself looking to sell the option you bought. To do that, you only have the option of selling it at the price the broker, where you bought the option, shows you.
While you can have multiple accounts with different Binary Options brokers and compare the price of the option you want to buy before actually buying it, once you are trading, if you want to relax, that is to close the trade before the actual expiration, you have no choice but to do so at the price the broker shows. In Forex of course, the market is freely priced at any given time and you know that you will get the fair market price for exiting your trade, not the broker’s price.
For Binary Options Summary and Forex Debate
Which trading option is the best i.e. the most profitable market to trade? Binary Options or Forex? This depends greatly on your own level of commitment in terms of hours per day in front of screens and discipline in risk management.
With Binary Options you may not need to be in front of a screen for many hours a day to monitor the markets on a regular basis which may be necessary when trading Forex. You can take your position and wait for the results with peace of mind that your maximum liability is the cost of the option. You won’t have to worry about maintaining your stop loss, it is fixed at the price you paid for the option and cannot be changed.
One thing common to both markets is the analysis required to make trading decisions. Whatever market you will be trading, you will always be looking at Fundamentals and/or Technical Analysis. For both markets, you will need to hone your analytical skills and create a profitable trading plan or strategy.
Fundamentals of Forex Binary Options Trading
Here, a professional trader, and founder of a currency trading and management consulting firm, shares his thoughts on the fundamentals of forex binary options trading. exchange and the system you personally use.
The strategy below is not a secret but it is also not very well known. Its simplicity is the reason for its success.
EUR / USD
The currency pair I usually trade is the EUR/USD pair. This is because it is the most volatile forex pair – but also predictable. It remains the most traded pair since the opening of the Forex market to retail investors. Daily volume has been on the rise since the early days. EUR/USD is also a pair used by financial companies to hedge against market swings.
One issue that frequently grows on binary options forums, is the volume of different strategies discussed or offered. Most traders think that the more complicated the system, the more profitable it is. When these forex strategies fail, the system is to blame. However, the real problem lies behind the screen. No strategy will adapt itself to evolving market conditions; Traders must adapt.
Many will assume that this strategy will not work under specific market conditions. The important point is that the market is binaryfeces; price will only increase or decrease. Different markets don’t really exist. Any system has the same end goal – to detect the best entries and exit points for any trade.
Example: An experienced trader will easily spot support and resistance levels. A beginner may not. Novice investors can use the strategy using:
- Random,
- Index
- RSI RSI
What they don’t see, however, is that these indicators give him the same entry point that seasoned traders use.
When trading forex binary options, detecting the best entry point and knowing the next price move is key.
Note: Below are my personal opinions and personal strategies I use. Everything should be read carefully. Don’t switch to high-risk methods without fully understanding how the strategy works. Consider trading with a demo account before risking real money. Be prepared to pass the transaction if something takes you off. Don’t force trading where there are no opportunities, opportunities will come.
Forex Fundamentals
The first point is to give an explanation of the forex market in general: Currency exchanges are governed by the law of supply and demand.
Here is a hypothetical example: Apple (A corporation based in the US) sells 1 million handsets across Europe, earning 500 euros each. EUR (€) is the base currency. They use HSBC for clearing, so these funds are received there. However – Apple reports in dollars and their management account is with BOA.
So Apple made 500 million euros in an HSBC account in Luxembourg. Those funds now need to flow into their BOA account and change into USD.
Now they need to exchange currency. The money order arrives on Tuesday at 4pm UK time. It will not be transferred immediately. Banks will accumulate all their USD orders overnight. This could have come a month ago.
The UER/USD pair is trading on Wednesday morning at 6 GMT at 1.27000. So Apple’s account with BOA will receive $635 million at 8 a.m. EST. The order is fixed at 1.27000. How do banks – or retail investors – make money from this transaction?
How profitable are investors?
BOA will obviously get a commission from Apple, but what about HSBC?
At 8 am GMT – opening of the London Market, the liquidity is 380 million euros. The price is 1.27010. So 500 million euros is equivalent to 635 050,000 USD. Currently, the market cannot process this transaction.
Extending the hypothetical example, this is how the markets look. The euro outlook is bullish. Asian markets rose overnight. The US financial cliff is being resolved. Millions of traders and retailers take BUY orders and place a stop 10 pips below the current price. There is currently a liquidity of 300 million euros pending plus a current liquidity of 380 million euros. The total liquidity then, in USD in the market at the moment is (1.27010) 482 638 000 USD and 381 030 000 USD pending (equivalent to stops).
Exchange currency
Market data shows stops at 1.26910. So, at 8:15 GMT, the sell order has available liquidity (a sell order is 8 million Euro). The effect of this is to push the price to 1.26905. Now, bank BUY orders are activated. Other retail investors now place new buy orders to cover losses.
Prices fly to 1.27099. Here we can exit our BUY positions gradually (assuming we followed the bank transactions). When the trend is still strong, people buy our orders. On the chart, this can be shown by a smaller sized green candle after the uptrend.
commercial results
So the market liquidity increases to 380 + 300 = 680 million euros. We got out at 1.27099 with a profit of 9.9 pips (from 1.27000). Once leverage was considered – and the sheer size of these trades – a huge amount of money changed hands. Banks (and retail investors) all use leverage to make big profits from those moves.
This is purely an example. The truth is that the volume is huge ($4 trillion per day). There are many traders, market makers and stakeholders in these markets, but that example is to show you how FX works and this is fundamental when analyzing levels and trend support and resistance (SR).
These levels are determined by the larger players. They also hold really well because retail investors discover them and use them too. The smart money cycle occurs in 3 price cycles. We will then see a short-term channel where the price is trapped for a bit of cumulative strength.
SystemsForex – Fibonacci
Price cycles are not random. They follow a sequence. This sequence is defined by a set of numbers known as the Fibonacci numbers.
Fibonacci numbers were not developed for trading. They occur throughout the natural world, where many biological systems can be described in terms of Fibonacci-like sequences.
Major forex traders (including banks) do not use indicators like RSI, CCI or MACD. They use systems based on the Fibonacci numbers.
Combining Fibonacci with accurate price channel calculations and information on how others trade, you have a profitable trading strategy for forex.
Forex uses binary?
Why would you consider all this when trading binary options? Unlike spot currency exchange, you need to be right more often. You need to specify the direction, not the size of the move.
During the trading day, this will not be relevant to the large trades shown above. I want the price movement pocket (and pips), so I need to use something that finds the price movement and reverses the price cycle. For binary forex trading (and fx spot trading) I use 3 indicators with very precise functions.
Forex Correlation
Forex correlation is an important tool. If you haven’t learned what they are – It may have harmed your trading. Correlation shows which pairs move together. In addition, it accurately identifies people moving in the opposite direction. Equally important, it will show which pairs are not related.
All this helps to evaluate what professions we should take. It can reduce risk, and also provide additional trading opportunities that are not obvious on the price chart.
How to read exchange correlation
Correlation is usually shown with values between -100 and 100. A value of -100 ( reverse correlation ) shows two forex pairs that move exactly opposite each other. If one rises, the other falls and vice versa. The number 100 means that the two forex pairs move together. If one increases, the other also increases. Likewise, if one person falls the other will too. Figures at the extremes of the spectrum are rare – but the closer the number is to -100 or 100, the stronger the correlation.
So the metric above – / + 70 is a notable correlation. Anything more than – / + 80 is a strong correlation. Consider the GBP/USD and EUR/USD crossover above. It gives a number between GBP/USD and EUR/USD of 89.6. This shows a strong correlation.
Next, rate USD/CHF in EUR/USD. It shows that the correlation between these two pairs is -95.4. This highlights a very strong inverse correlation. When EUR/USD rises, USD/CHF falls and vice versa.
With multiple pairs, there is no relevant correlation. Where a value (positive or negative) is less than 60, the correlation is not very strong. Anything around 0 shows no correlation between the pairs. Take for example the NZD/USD and EUR/USD pairs. The correlation here is -1.7. This means that there is no discernible correlation, on a daily basis, between these pairs. In other words, the rise or fall of NZD/USD tells us absolutely no about what EUR/USD can do.
Correlation Range
Correlation tables are created and updated based on hourly, daily and weekly timeframes. All of these timeframes provide valuable information depending on the timeframe you trade. For short-term trading, hourly and daily correlations will be the most important. Numbers change, so don’t take the above as gospel.
Why Forex Correlation Matters?
There are a bunch of reasons to be interested in forex correlations. The biggest reason I follow them is to control risk. For example, a trader might claim that trading multiple pairs has provided them with diversification. Only by knowing the pairwise correlation can this be guaranteed.
If you go long (buy call) with EUR/USD, GBP/USD and sell (put call), USD/CHF you have essentially taken 3 very similar positions. If a person is against you, they are likely to turn against you. The risk has tripled. If leverage has also been used, the risk is great.
Another reason why forex correlations are important, is that they can provide you with trades that you may not have seen yet. For example, you believe the EUR will appreciate against the USD (i.e. EUR/USD will rise). You look at the chart and don’t see a great trade setup. Since you know that GBP/USD generally moves with EUR/USD (based on current correlation), you can also test GBP/USD to see if there is a better trade setup.
You may also want to see if there is a short (buy) trade setup in USD/CHF as it usually moves in the opposite direction.c back of EUR/USD. High correlation (positive to negative) gives you alternative trades; Choose one of the best trade setups.
Confirmation of transaction
I also like to use forex correlations to confirm trades. When I find highly correlated forex pairs, I will use one to confirm other trades. For example, if EUR/USD rises and I want to go long (buy call), I also want to see GBP/USD rise. Since these pairs are highly correlated, they will move together. When they didn’t, it warned me that maybe I should take a closer look at my trade. That doesn’t mean I won’t trade. These correlations change and the two pairs never move perfectly in harmony. That means I better have very good reasons to make a trade (as you should always).
Correlation can be a complex statistical topic. Hopefully this introduction has given you enough concepts to do a bit of your own homework. Regularly check correlations to recognize the relationship between forex pairs that can affect your trading.
Use correlation data to control risk, find opportunities, and filter trades. If you’re having trouble seeing how the correlation works, try looking at the metrics in the correlation tables and then pulling up the price charts of the two forex pairs in question. Notice how the pairs move relative to each other; Doing this will help create a common understanding of the correlation.
Swing Trading – Definitions and Examples
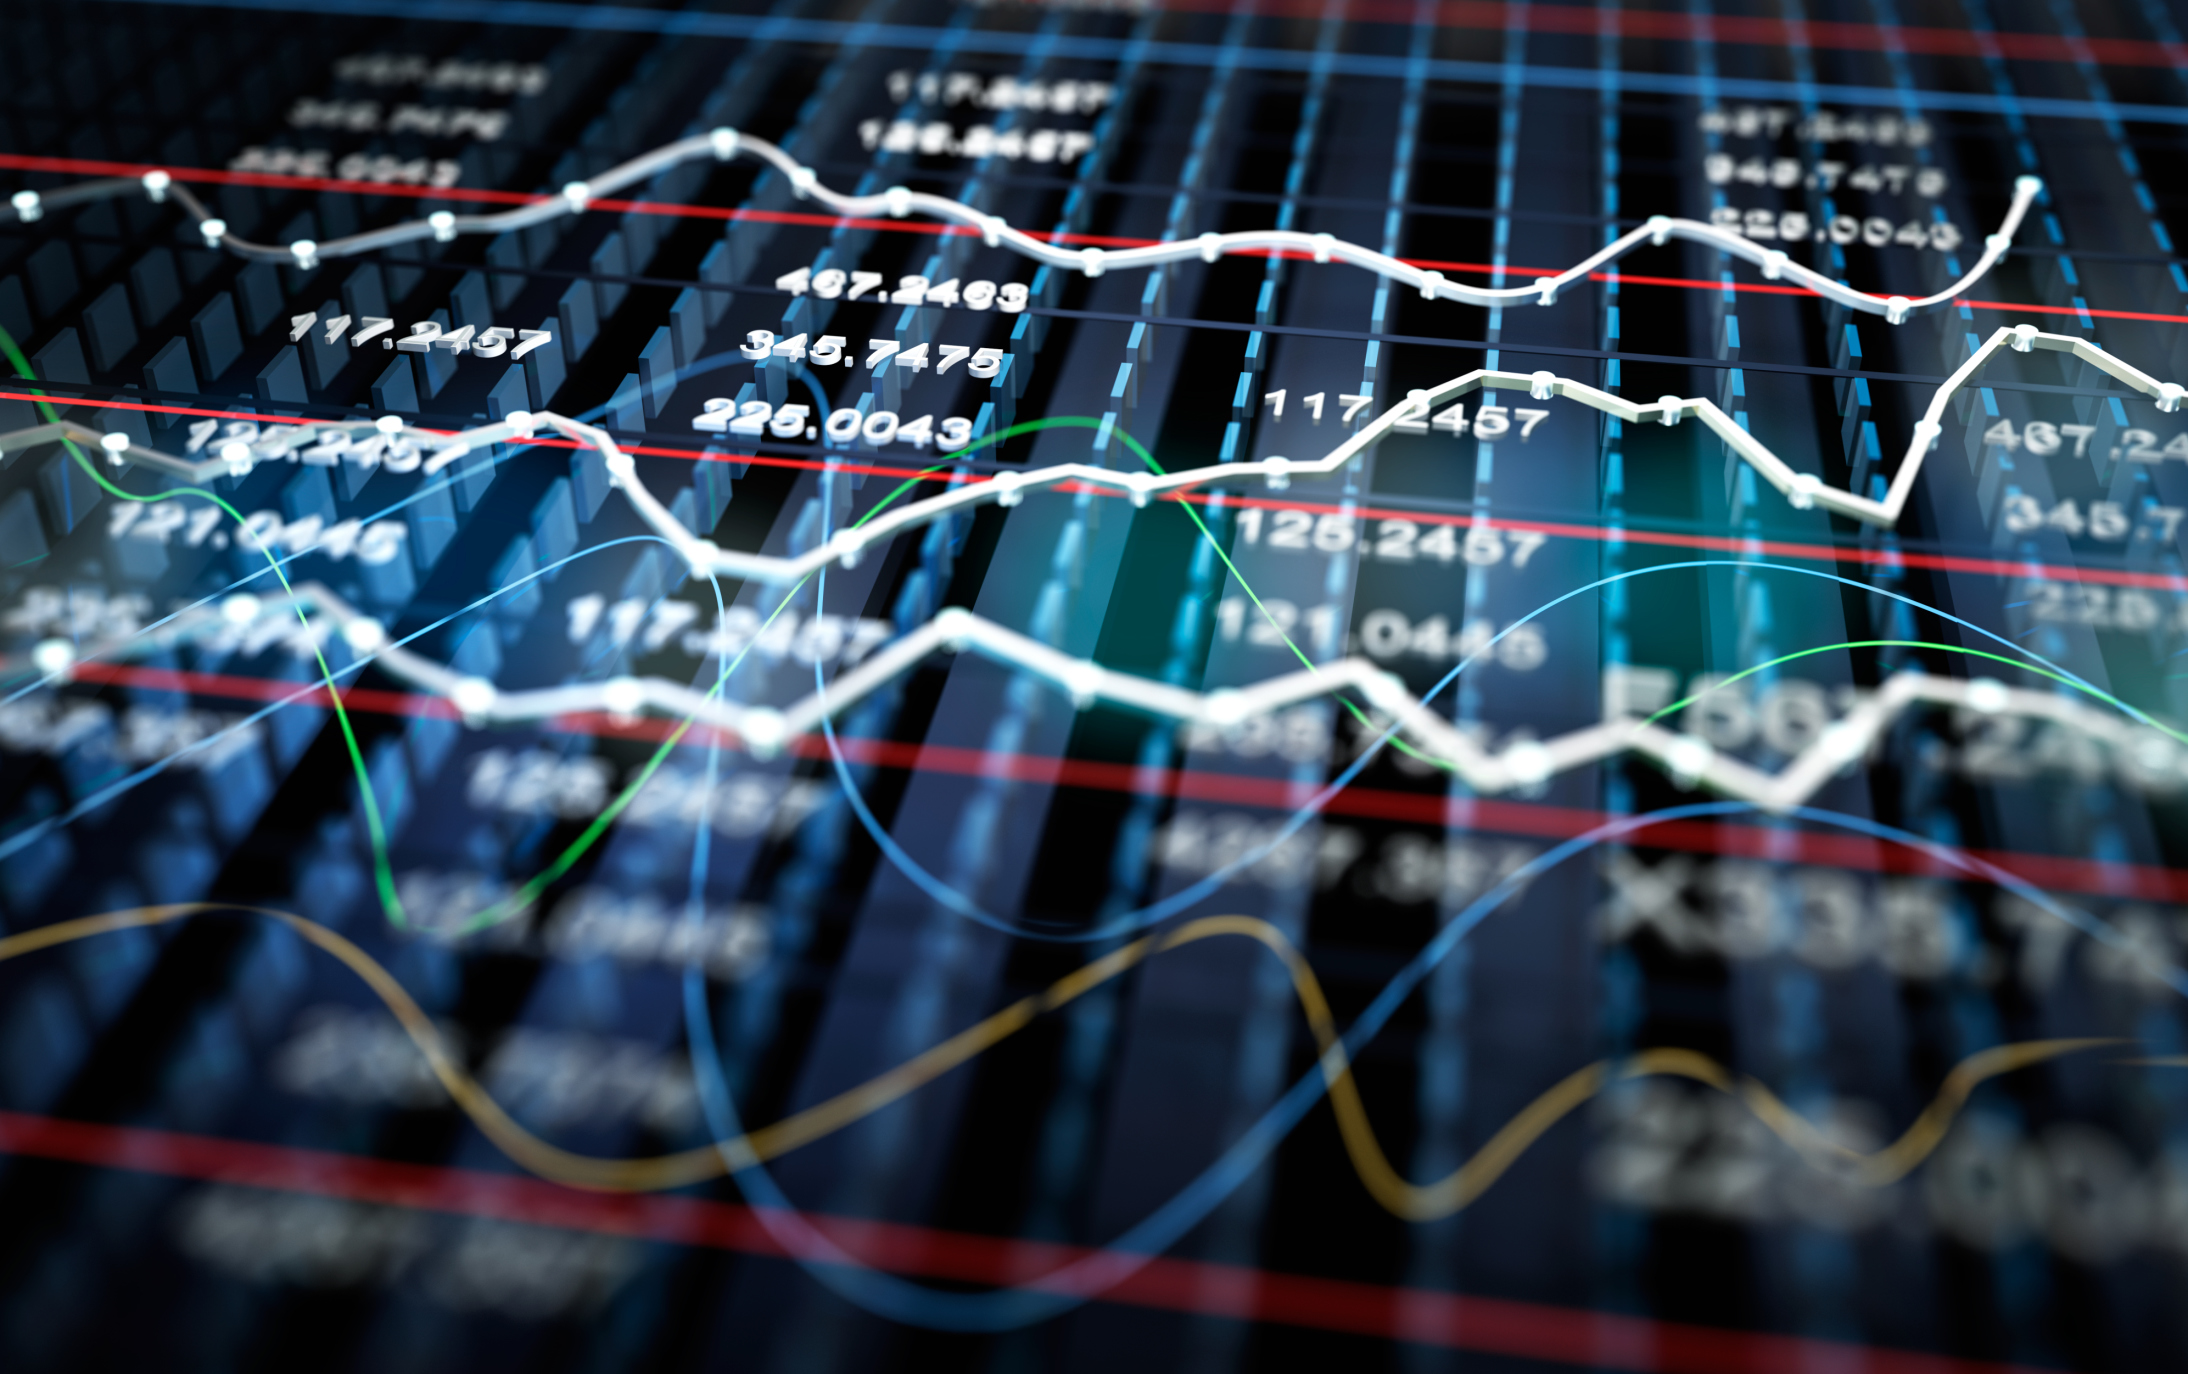
Stock exchange graph background, 3D illustration
A “swing” trade is generally one that is open between one and five days. A trader is trying to follow the momentum of an asset’s price, usually within an established trend channel.
The idea of “swing” trading comes from the stock market and is a type of trading strategy followed mainly by retail traders. The reason is that it is very difficult for institutional traders to put in positions of the size type they need without moving the market.
This may not necessarily be the case for the Forex market as the major pairs are all very liquid and there is a large interbank market. Traditionally, trading positions themselves revolved around the intervals between day traders and mid-term investors or traders. An intraday trader will hold a position for a few seconds or at most while a mid-term investor might hold a position for several weeks.
However, the forex market is a very different kind of ball game. Even during the strongest uptrend or most savage bear trend, you can still see the day’s price action go through several highs and lows, instead of going in one direction all day.
Swing traders in the Forex market can also be day traders, trying to capitalize on bullish momentum to fall and rise. Their job is to enter the market when momentum is up, but leave as soon as the market turns once again to the bottom.
What is the analysis behind the Swing strategy?
Swing traders, due to their short holding periods, are not interested in fundamentals and are mainly focused on technical analysis. It could be something as simple as a 3-day moving average crossover strategy, adjusted for early entry and exit. Or a more complex mixture of different technical indicators that overlap.
In any case, the intention is the same, to get in early when momentum changes and to rotate positions when the market pulls back. This strategy, therefore, works especially well when the market is trending sideways instead of up or down. The forex market is volatile even when there is a clear trend, but trying to sell in a strong bull market early enough to catch the swing can be painful.
Identify the right market
Determining if the current market is suitable, within a given timeframe is crucial to the successful outcome of this strategy. You have to consider the time period you trade, in the Forex market, fluctuations occur over a relatively shorter period of time. Therefore, it is essential to stick to the time horizon you are trading in to determine if the market is trading sideways. A sideways market is identified when the highs and lows fail to break through the previous highs and lows, resulting in so-called channels as well as other chart patterns.
The shorter the timeframe, the shorter the difference between the high and the low, or the shorter the price action channel. For the daily chart, you can expect most majors to be drifting instead of tending to havechannel width from 2% to 6%. In comparison, if you are looking at the hourly chart, the channel might look like 0.5% to 1.5%. Usually a sideways market for a period of less than a day can move in a very tight range as the market consolidates its new level.
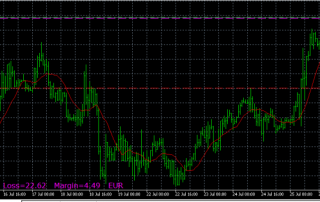
Let’s look at some examples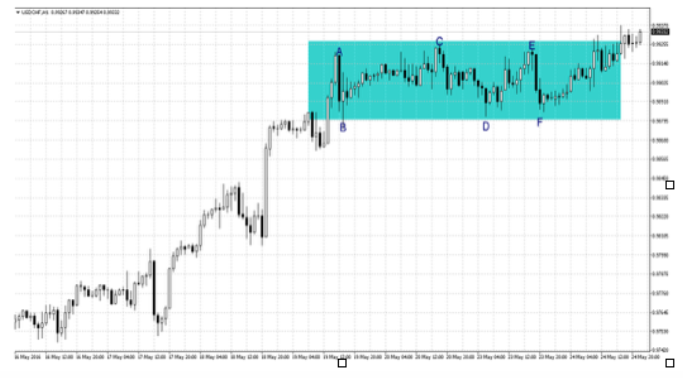
The hourly candlestick chart in the first image is for USDCHF. As we can see, the pair experiences a relatively tight price range around 45 pips, between 0.98800 and 0.9925. The blue rectangle goes from May 19 06:00 a.m. to May 24 03:00 p.m. GMT, highlighting how the price action has been sustained throughout that time. The swingman’s job is then to try to short or sell at points A, C, and E and go long or buy at points B, D and F.
In swing trading, there is no downtime; strategy consists of long or short continuous. So there is no close and wait period, which can be useful when the market pulls back allowing you to re-enter the market at a better price than you exited. However, it can be frustrating if the trend is sharp and continues.
Therefore, it is essential to identify the breakout of sideways price movement and the development of bullish momentum in one direction. From the chart above, it looks like there was in fact a breakout of the channel pattern. Three of the last four bars that have closed above the blue rectangle should raise a red flag for a swing trader. The sideways action may not develop into a new uptrend. However, the fact that the price has moved above its channel should create caution. It remains to be seen whether the market has now found new impetus or simply a higher upper side of the channel.
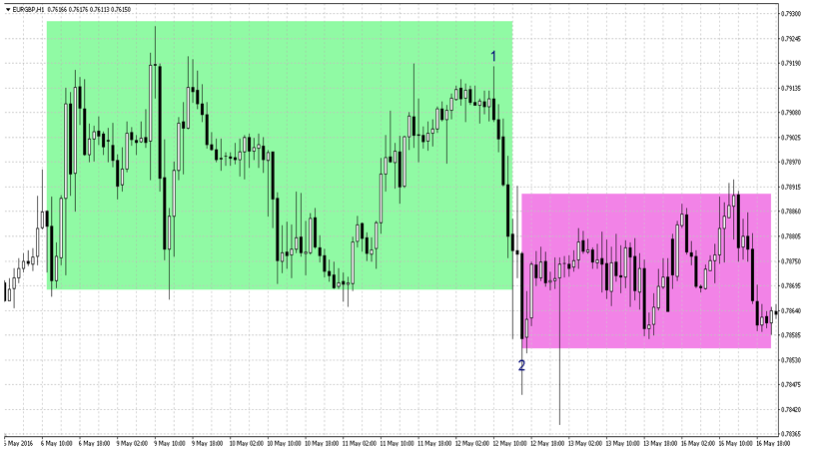
The hourly chart in the second image, for EURGBP, shows how price action moved from one side channel inside the green rectangle to another side channel lower in the pink rectangle . As price moves from point 1 to point 2, it may be tempting to open a short position at point 2 with the view that a new bear trend is underway. Only to find that the price is now moving back higher again and trading in a range.
Finally, use caution, but even if you are not a swing trader identifying a sideways market helps not to get caught up in swings. Correctly identifying the market mode will allow you to avoid buying when the market is about to close, or selling when the market is about to bounce back.