


A subset that is often underestimated in technical analysis, known as market data level II , can be very useful to traders. Tier II market data shows a broader range of market orders beyond the base bid, ask, and market price. Specifically, it expands on the information available in the grade I variety.
Level II data is also known as “depth of market” by showing the number of shares, contracts or lots available at each individual price.
Also, it is often referred to as the order book, as it shows a series of orders that have been placed and are waiting to be filled. Orders are filled whenever buyers and sellers in the market agree to trade at a certain price.

Tier I market data
Level I data includes:
Bid : The highest price a market participant is willing to buy an asset or security at.
Bid Size : The number of assets that market participants are looking to buy at the bid price. This can include stock quantities (e.g. stocks ), contracts (e.g. futures ) or lots (e.g. forex). Sometimes this number is divided by 100 (and sometimes another number) simply to shorten the number of digits to use.
Ask Price (also known as Ask Price ): The lowest price a market participant is willing to sell an asset or security at.
Ask for size : The number of assets that a market participant is willing to sell at the asking price. This may include the number of shares, contracts or lots.
Market price (sometimes final price ): The price at which the last transaction settled.
Market Size (sometimes final size ): The number of shares, contracts, or lots involved in the previous transaction.
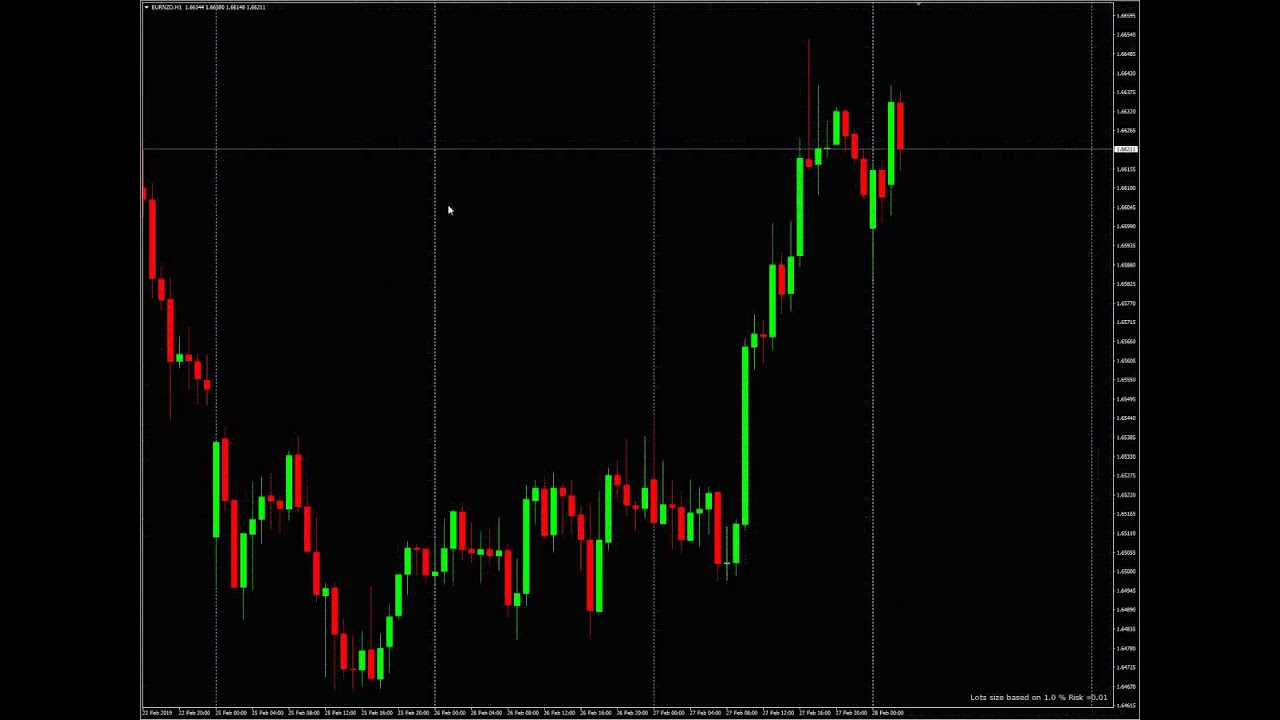
Traditional technical analysis, which involves trading on price action or indicators involving price and/or volume movement, is based on Level I data.
Standard Level I data can usually be viewed in your broker. For example, here’s the tier I data on Google stock (GOOG):
This shows bid, ask, current market price, current size (bid and ask size both are approximately 200 shares, as indicated by the 2 2 2 2)
Level II Market Data (Market Depth / Order Book)
Level II data includes multiple bids and ask/offer prices . This shows what other market players are bidding and offering across a variety of prices. In addition to Tier I data, Tier II includes what other market makers are setting their buy and sell levels for.
What are market makers? They are securities or asset dealers that provide liquidity to the market by being willing to buy and sell at a specific price at all times.
For most traders, Tier I data will be available to you through your broker. And often, but not always, for free.
For those who depend on more in-depth data, such as what type of order size is set at what price, they will need Level II data. This is usually provided by brokers for a fee. It may be free or it may not be available on some brokers at all. Tier II data is typically more expensive than Tier I data on stock and futures exchanges. It is often free on many brokers forex .
For an example of the difference between Tier I and Tier II data, let’s say you are trading a stock with a market price of $25; bid is $24.98 and ask is $25.02. This is standard level I data.
Level II will include a list of bids and asking prices up and down the ladder. For instance, you might see bids at $24.95 and $24.92 with sizes larger than you’d see at regular tier I bids and ask for prices at $25.05 and $25.08 dollars. Generally, there will be about five to twenty different bids and ask prices, all from different market makers and market participants.
Below is a list of the information contained in Level II data:
Multiple bids : Tier II data includes bids from Tier I data as well as all other bids below this number. In the most liquid markets (those that are most traded), you can see bids for each individual rally – for example, for every $0.01 in a large-cap stock. If the asset or security has a large bid/ask spread – that is, the difference between bid and ask is 0.1% or more of the security price – they are also likely to have a sizable gap in bids. and ask for arbitrage in market depth data.
Bid Size : The number of assets that market participants are looking to buy at different prices.
Multiple Asks : This includes inquiries from Tier I data and inquiries above this number. As is the case with bid data, ask prices will often be relatively close together in the most liquid markets. In less-traded, illiquid markets, bids will be spaced apart.
Ask for size : The number of assets that market participants are looking to buy at different prices.
Example of tier II market data
This shows an example of Tier II data for a NASDAQ stock:
The top part of the chart shows bid (160,950) and ask price (160,960) or standard Tier I data.
Level II data includes bids that are completely on the center left column and questions that are completely on the center right column.
To the left of the bid (column starting with 160,950) is the size or number of shares, offered for sale at that level.
The next column is the cumulative size. That represents the total number of shares that will be offered to support the stock price before it drops to that price.
The same is done on the asking side (right hand side).
The left and right columns are very representative of the different market makers.
Many traders like to look at the cumulative number of shares offered at each level. If there is an imbalance, that could signify which side of the market is leaning in favor of a particular asset or security. Traders can also look at the sizes offered at bids and ask to get a general understanding of where the market is likely to head.
In this particular example, there are multiple shares offered for sale on the asking side (left side), indicating that buyers are, in effect, stronger than sellers. Accordingly, this can notify a trader of a bullish bias when the level II data/order book is involved in the decision-making process.
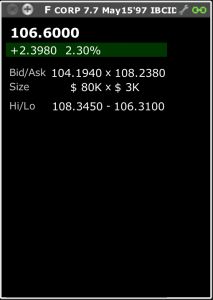
In terms of other examples, but based only on Tier I data, below we see a Ford (F) bond with a size of $80K at bid and $3K at ask. This means that the market is clearly bullish, or hoping for this particular security to move higher.
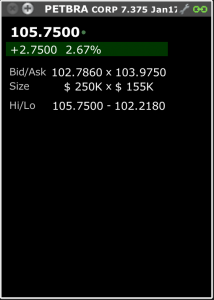
We see the same for the following Petrobras (PETBRA) bonds with sizes of $250k at bid and $155k at ask. A bid greater than the ask represents a bull market.
On Omega Investors Investors (OHI) stock, you may see twice the size of the ask versus bid. This signifies a more downtrend.

Some traders will also look at any asymmetry in terms of where the latest trades take place. If more trades are taking place closer to the bid (lower price), it could suggest that the price may be trending downwards. If more deals are filled closer to the request (higher price), it could indicate that the price may be trending up.
None of this, of course, is fool proof. Orders can come in at any time to affect the direction of the market.
Conclusion
Tier II market data, also known as market depth in the market and order book, view bids and ask for price and size excess bids and ask for the closest price to market in tier I data .
Day traders can get both Tier I and Tier II market data through their broker. Tier II data should be available for stocks and futures trading. However, there may be an additional fee for this. Some offer Tier I and Tier II data for free, but can compensate by charging a higher commission per transaction.
Many forex brokers offer Tier II market data, but some do not. Many will just give you Tier I data and a charting background.
Level II data is generally not used in isolation as a trading strategy. Day traders will often use it alongside technical analysis strategies or alongside fundamental analysis. But it can be an additional form of analysis to help better inform trading decision making.