


Today’s trading strategy is about one of the most reliable continuation patterns, the Bear Flag Pattern . Our bear flag chart pattern strategy will give you a framework to conquer market trends.
Our team at Trading Strategy Guide is working hard to put together the most comprehensive guide on different chart pattern strategies. To understand the psychology of a chart pattern, please start here: Step by Step Guide to Chart Pattern Trading Strategy .
One of the first experiences most traders learn when they start trading is price action trading. One of the most common price action patterns you may have heard of is the bear flag pattern.
A bearish flag is a very simple continuation pattern that develops after a strong downtrend.
It doesn’t matter if your preferred timeframe is the 5-minute chart or if you prefer the long-term chart. The bear flag pattern appears with the same frequency on all timeframes.
A continuation pattern, like a bear flag, brings some good news because it tells you after the market has gone down that it will continue to go down further.
If you miss the initial sell-off, the market is without you and you spot a bear flag pattern on that chart, this is a sign and safe place to sell so you can enjoy the rest. back of the downtrend.
We will also give you a very clear set of step-by-step rules so that you can trade the Bear Flag chart pattern strategy on your own.
Moving forward, we will discuss what constitutes a good bear flag pattern. We will outline five basic trading rules for conquering the market with the Bear Flag chart pattern strategy. You can also read simple but profitable strategy .

What is a bear flag pattern?
A bear flag is built in a descending or downtrend, followed by a pause in a trendline or consolidation zone. Strong down move is also called flagpole while consolidation is also known as flag.
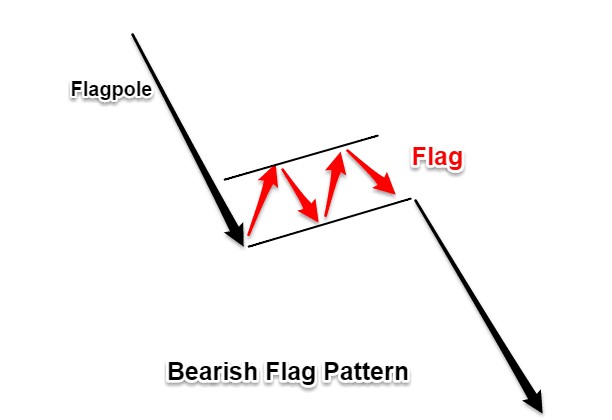
The bear flag pattern appeared after a strong move down. The stronger the move, the greater the profit potential.
As you can see in the image below, after the market plummeted, it entered a consolidation – a very narrow range – to correct to a new low.

Note * For a valid bearish flag, the support and resistance lines that make up the flag need to be parallel and will usually slope upwards.
The Bearish Flag Pattern has some similarities with the Rectangle Pattern . The difference is that in the rectangle pattern, the price action is moving horizontally in a much larger trading range.
Psychology behind the bear flag pattern
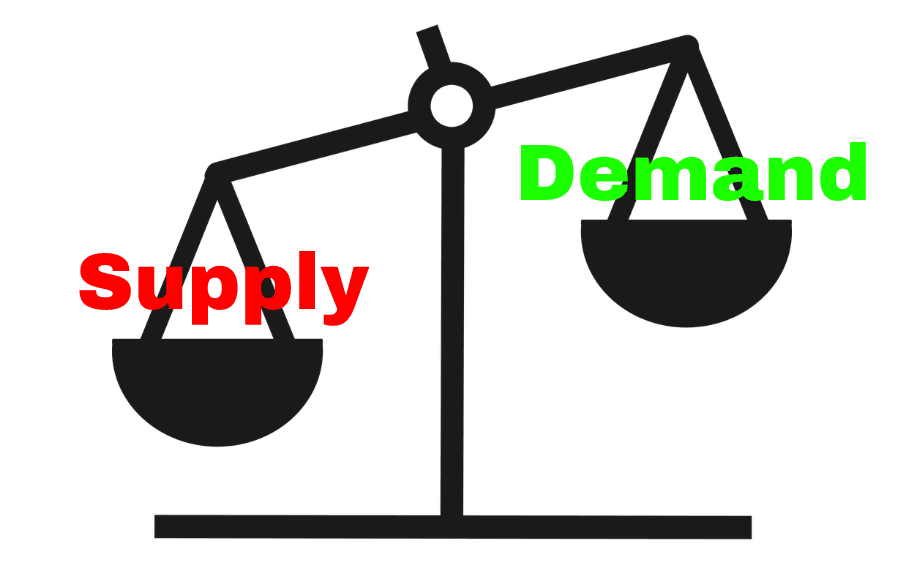
The bear flag pattern highlights a trading environment where the balance of supply and demand has shifted badly in one direction of the market (supply > demand). In turn, this will produce very little reverse retracement, allowing a flag structure to form.
After the initial sell-off, those who missed the train would panic and start selling. Many will sell it during the flagpole stage.
During a pause or narrow consolidation, people wait to get a higher price so they can sell. But because the supply and demand equations are so out of balance, this won’t happen. We get another smash that will cause many chasers to move to the downside again.
Now let’s see how you can effectively trade with the rectangle chart pattern strategy and how to profit from using the bare chart. You can also read about traces stop or hard to take profit for better trading.
Bear Flag Pattern Strategy – Selling Rules
Now that you’re familiar with bearish flag formations, let’s go through an easy step-by-step guide. It will create an easy trading strategy for you to navigate the market.
The best thing about the bear flag pattern is that there is a very easy way to know how low it will send the currency price.
We did something different with the Bear flag chart pattern strategy. We will teach you a new way of trading bearish flags.
Now it’s time to go through the bear flag chart pattern strategy step by step guide:
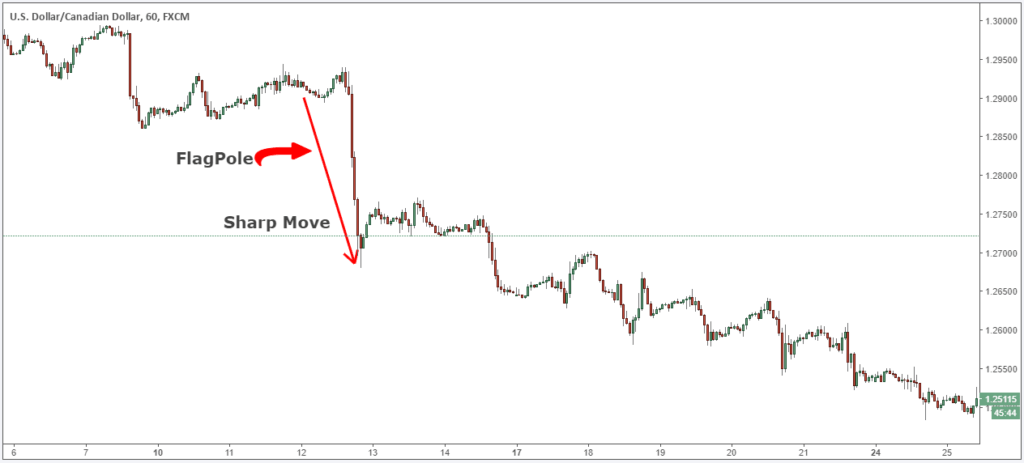
Step #1: Look for evidence of a previous downtrend. For a valid bearish flag, you need to see a sharp drop.
Just because you can spot a bear flag pattern, doesn’t mean you have to jump straight into the market and trade it.
Remember, we need the right context and the right price structure to line up for a tradable bearish flag.
So the first step is to identify the market trend before the flag price is formed.
First, a valid bearish flag needs a sharp decline. This is strong evidence of a downtrend and imbalanced supply and demand.
Note * The sharp move is also the Flagpole – the first element of the bearish flag structure.
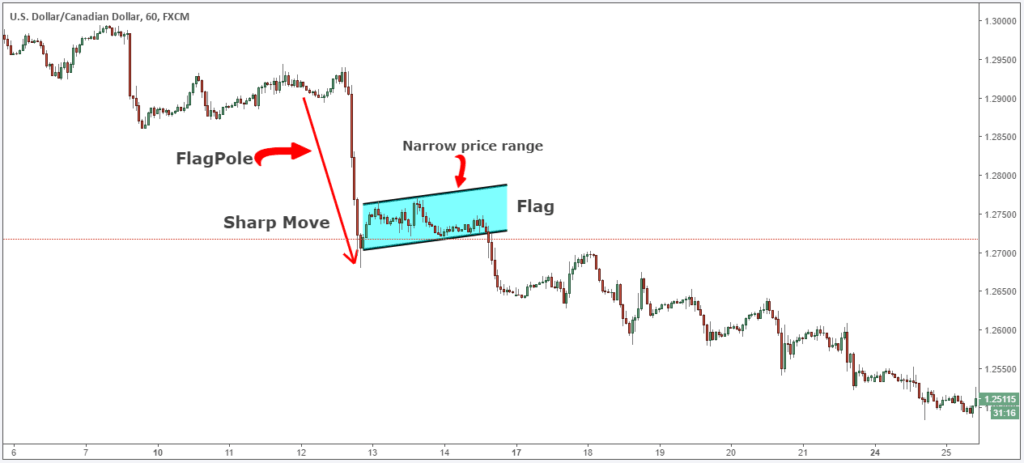
Step #2: Identify the flag price formation. Price action needs to move in a narrow range between two parallel lines.
The flag price formation is the second element of the bear flag pattern.
Basically, all you need to do is spot a support and a resistance level. It must contain price action in a very narrow range.
The narrow range is the key to the success rate of the bear flag pattern.
As far as possible.
Now, we need to define an entry technique for our bear flag strategy.
See below:
Step #3: Sell at the closing candle creating a Breakout Flag.
After we identify the market trend and the characteristics of a good bearish flag pattern, we need to wait for confirmation that the trend will continue.
There are two basic approaches to entering the market with the bear flag pattern. Active traders will participate in the head of the bearish flag as this will guarantee a bit bigger profit.
If you are a conservative trader, you can wait for the confirmation provided by the flag breakout.
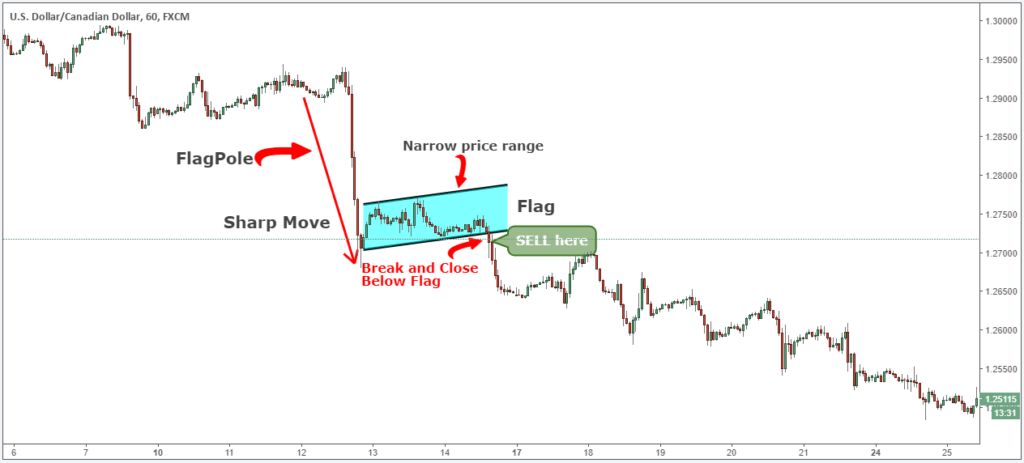
Our team at TSG prefers to take a conservative approach and wait for a break and close below the bearish flag before taking a trade.
The bear flag chart pattern strategy only looks for trading opportunities when you get a breakout below the flag price structure to become a seller.
The next important thing we need to set up is where to place your protective breakpoint.
It is important when looking at this type of strategy to keep things in the context of the overall market. Too many traders will try to zoom in
See below…
Step #4: Place the guard stop slightly above the Flag.
The Rectangle chart pattern strategy gives you a simple way to quantify risk as you can place your protective stop loss above the flag price structure.
We are accomplishing two things with our tight stop loss:
- Small loss.
- The risk is higher than the reward.
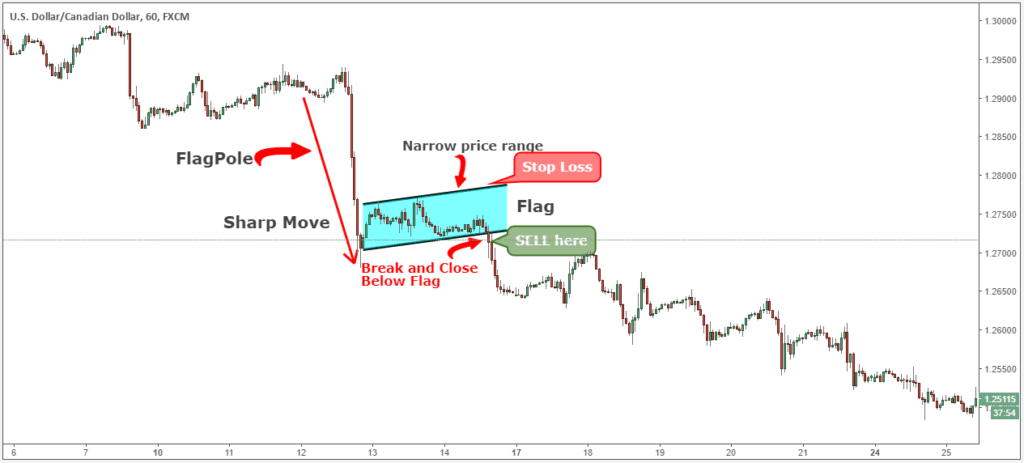
With such tight stop loss you will feel comfortable losing multiple trades in a row because with great RR the bearish flag has the potential to wipe out all your losses in a single trade and still be profitable .
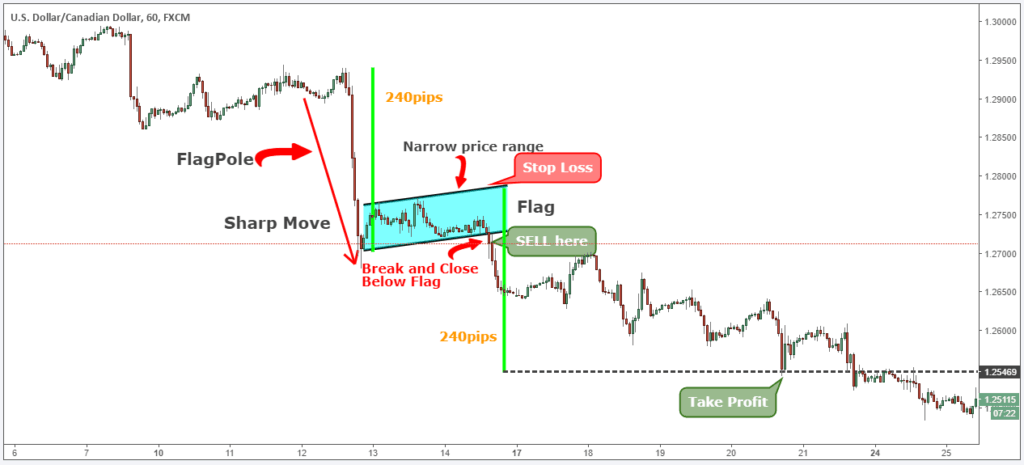
The next logical thing we need to set up for the bear flag strategy is where to take profits.
See below…
Step #5: The profit target is equal to the same price distance of the Flag column as measured from the top of the bearish flag.
The textbook profit target is the height of the flagpole measured from the top of the flag.
Our team at TSG has learned that the market likes this kind of price symmetry and we want to take advantage of it.
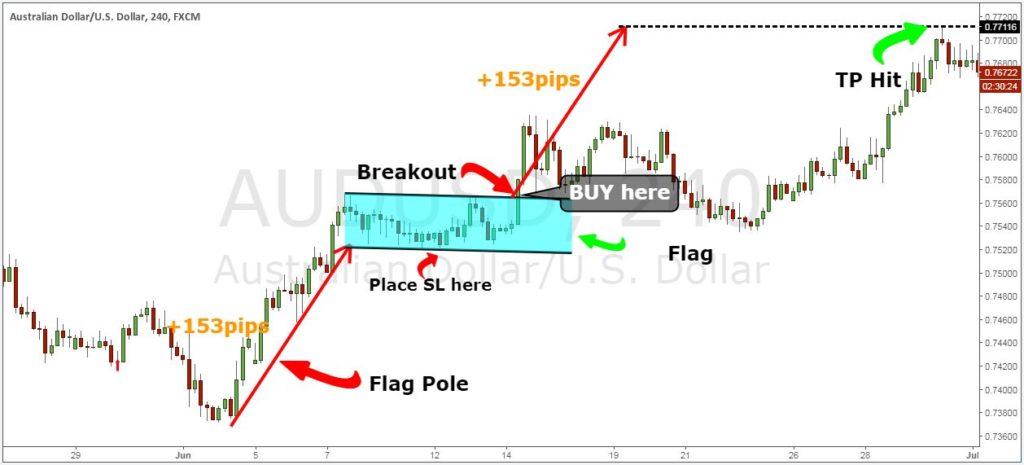
Note *** Above is an example of a SELL trade Use the same rules – but in reverse – for a BUY trade, but this time we will use a bull flag or a bull flag. In the image below you can see a real BUY trade example, using a bullish flag pattern.
Conclusion
Identifying a bear flag will be an easy job but if you have the right trading conditions, a bear flag can be a great trading pattern to start growing your account. The important thing about the bear flag chart pattern strategy is that it is a strategy that only works in a bear market and it works beautifully.